Appendix I – Event Measurement Parameters
|
Parameter |
Description |
Range |
|
Unbalance |
Overview:
Calculation Method:
|
From 0 % to 100% |
|
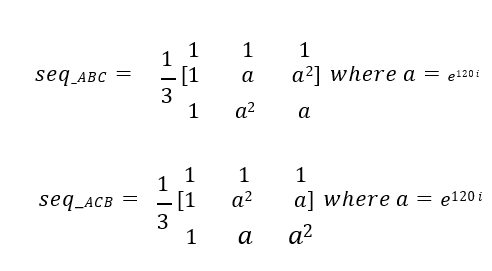
Phase Sequence |
Parameter that represents the sequence of voltage Phase ABC or ACB. |
|
|
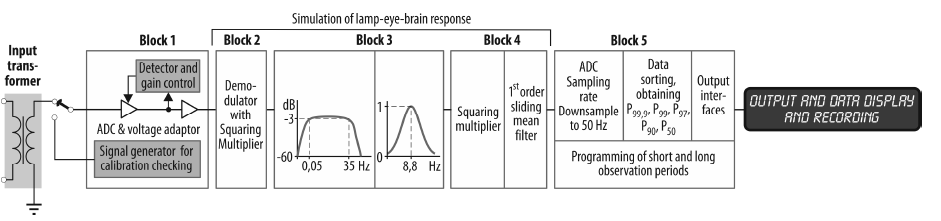
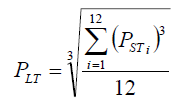
Flicker |
Overview:
Calculation Method:
The Flicker is Implemented according to the IEC-FLICKER-METER standard with 2 weighting filters that can be configured by the user either 230V lamp or 120V lamp
|
3 to 100 |
|
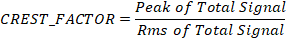
Crest Factor |
Overview:
Calculation Method:
|
0 to 200 |
|
Line Voltage |
Overview:
Calculation Method: |
---- |
|
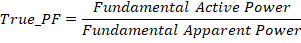
True Power Factor |
Overview:
Calculation Method:
|
-1 to 1 |
|
Delta Configuration |
|
|
|
Frequency |
Frequency measured on 10/12 cycles according to Frequency configuration. 10 Cycles for 50 Hz Frequency Configurations, And 12 cycles for 60 Hz Frequency Configurations. |
-At 50 Hz configuration: From 40 to 60 Hz. -At 60 Hz Configuration: From 50 to 70 Hz. |
|
Frequency 10 Seconds |
It is an average frequency of (Frequency 10/12) for 10 Seconds. This Time window is not Sliding time window. 1st 10 second it will equal to zero until time window complete 10 seconds. Then Update Rate will be each 10 seconds. The Parameter will be zero in the beginning until the period is fully monitored by the device. |
-At 50 Hz configuration: From 40 to 60 Hz. -At 60 Hz Configuration: From 50 to 70 Hz. |
|
Total and Fundamental Voltage RMS |
It is Root Mean Squares of Voltage Samples during 10/12 cycles. There are two options one for fundamental Voltage Signal and one for Total Voltage Signal. Total Signal is Fundamental one Plus all Harmonics and Transients without any filtration done on the signal. |
---- |
|
Total and Fundamental Current RMS |
It is Root Mean Squares of Current Samples during 10/12 cycles. There are two options one for fundamental Current Signal and one for Total Current Signal. Total Signal is Fundamental one Plus all Harmonics and Transients without any filtration done on the signal. |
---- |
|
Angles |
The Angles are measured with respect to The Reference Signal. The Angle of Reference signal is always zero. The priority of choose Reference Signal VA then VB then VC. For example, if VA is Down then VB lead and if VB is also down VC lead. |
From 0 to 360 |
|
THD |
Total Harmonic Distortion have two different Definition THD_F and THD_R. THD_F is measure total harmonics with respect to fundamental signal. THD_R is measure total harmonics with respect to Total signal. THD_F = √ [(V2 )^2 + (V3 )^2+…] / V1 THD_R = √ [(V2 )^2 + (V3 )^2+…] / √ [(V1 )^2 + (V2 )^2+…] |
THD_F = 0 to 200 THD_R = 0 to 100 |
|
K Factor |
There is Equation Defined for this parameter, it applied on current Signal only. |
0 to 100 |
|
Powers Parameters |
Power Value for each channel, Refresh rate 10/12 cycle, Computed for Total Signals and Fundamental Signals. Apparent Power = V*I (VA) Reactive Power = V*I*Sin(α) (VAR) Active Power = V*I*Cos(α) (Watt) |
Update Rate 10/12 cycles. |
|
Energy Parameters |
Energy Values computed over 10 min fixed Window, Refresh rate 10min, Computed for Total Signals and Fundamental Signals. The Parameter will be zero in the beginning until the period is fully monitored by the device. Active Energy (+) = ∑ (Total Positive Active Power) dt , the load attached in Consume Mode in this time Interval by this Quantity , K.W.H. Active Energy (-) = ∑ (Total Negative Active Power) dt , the load attached in Generation Mode in this time Interval by this Quantity , K.W.H. Reactive Energy (+) = ∑ (Total Positive Reactive Power) dt, the load attached Cause Lagging in the system in this time Interval by this Quantity , K.VAR.H. Reactive Energy (-) = ∑ (Total Negative Reactive Power) dt, the load attached Cause Leading in the system in this time Interval by this Quantity , K.VAR.H. Apparent Energy = ∑ (Total Apparent Power) dt. Note: In three Phase systems the integration is done on total powers. So the energy not for each phase but oriented on the whole system. And the integration of Energy Reset Each 10 Min to start from zero each 10 min. |
-Time window to Calculate Energy is 10 min (fixed window). -Update Rate 10 min. |
|
Power Demand Value |
They are Average Power for the system not for each phase, computed during a Time Interval Chosen by the User (ex 4 min), this time window is sliding with Refresh rate 10/12 cycle (So we can say average power of the system last 4 min), Computed for Total Signals and Fundamental Signals. The Parameter will be zero in the beginning until the period is fully monitored by the device. Active Power Demand Value (+) = (1/N) * ∑ (Positive Active Power) , the load attached in Consume Mode in this Time Interval by this Quantity , K.W.H. Active Power Demand Value (-) = (1/N) * ∑ (Negative Active Power) , the load attached in Generation Mode in this Time Interval by this Quantity , K.W.H. Reactive Power Demand Value (+) = (1/N) * ∑ (Positive Reactive Power) , the load attached Cause Lagging in the system in this Time Interval by this Quantity , K.VAR.H. Reactive Power Demand Value (-) = (1/N) * ∑ (Negative Reactive Power) , the load attached Cause Leading in the system in this Time Interval by this Quantity , K.VAR.H. Apparent Power Demand Value = (1/N) * ∑ (Apparent Power) Demand Power Factor = Total Active Power Demand Value (+)/ √[(Total Active Power Demand Value (+) )^2 + (Total Reactive Power Demand Value (+))^2] |
-Time window to Calculate Energy up to 60 min (Sliding window). -Update Rate 10/12 cycles. |
|
Power Demand Quantity |
They are Energy for the system not for each phase, computed during a Time Interval Chosen by the User (ex 4 min), this time window is sliding with Refresh rate 10/12 cycle (So we can say Energy of the system last 4 min), Computed for Total Signals and Fundamental Signals. The Parameter will be zero in the beginning until the period is fully monitored by the device. Active Power Demand Quantity (+) = ∑ (Positive Active Power) dt , the load attached in Consume Mode in this Time Interval by this Quantity , K.W.H. Active Power Demand Quantity (-) = ∑ (Negative Active Power) dt , the load attached in Generation Mode in this Time Interval by this Quantity , K.W.H. Reactive Power Demand Quantity (+) = ∑ (Positive Reactive Power) dt, the load attached Cause Lagging in the system in this Time Interval by this Quantity , K.VAR.H. Reactive Power Demand Quantity (-) = ∑ (Negative Reactive Power) dt, the load attached Cause Leading in the system in this Time Interval by this Quantity , K.VAR.H. Apparent Power Demand Quantity = ∑ (Apparent Power) dt |
-Time window to Calculate Energy up to 60 min (Sliding window). -Update Rate 10/12 cycles. |
|
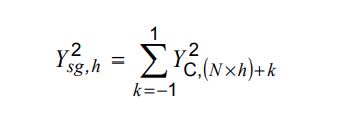
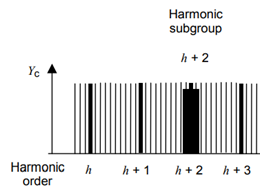
Harmonics |
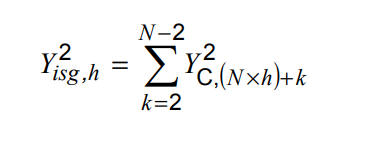
The Representation of harmonics are based on Type, Level, Phase for each order. Orders: 1st order represent fundamental Signal, 0th order Represent DC Bias, 2nd order represent harmonics with frequency = 2*frequency of fundamental Signal. -Levels: Harmonics can be represented by Normal Level or Grouping Level. -Normal level is RMS of Harmonics itself. -Grouping Level is Harmonics Subgroup as defined in IEC 61000-4-7. This Is Equation of Harmonics Subgroup (Grouping Level).
-Phases of Harmonics: are just used in reconstruction the signal to go back from Frequency domain to Time Domain. -Harmonics Power: are the Active power for each harmonic. -Interharmonics: it is a computation of Signals In between Harmonics as defined in IEC 61000-4-7 .
|
Orders from 0 to 60 |
|
Mains Signaling voltages |
It’s a parameter measured according to: -Frequency of Ripple Control Signal from 10 up to 3000Hz. -User Choose Recording period from 1 sec up to 120 sec. -User choose Mains signaling threshold from 0.3% of nominal voltage up to 15% -The Parameter will be zero in the beginning until the period is fully monitored by the device. -There are two method to compute Mains Signaling (the both are used) according to IEC 61000-4-30 : 1- When Ripple Control Signal Frequency located at any interharmonics pins then mains signaling rms = rms of interharmonic pin that match this frequency. 2- if Ripple Control Signal Frequency doesn’t locate at any interharmonics bins then mains signaling = root of the sum of the squares of the 4 nearest 10/12-cycle r.m.s. value interharmonic bins. -Device Records Max value of Mains Signaling Voltage at recording period that exceeds threshold and normalize it according to nominal voltage so it will be Percentage unit. -The beginning of a signalling emission is detected when the measured value of the concerned interharmonic exceeds the detection threshold. The measured values are recorded during a period of time specified by the user, in order to give the maximum level of the signal voltage. |
0 to 100 |
|
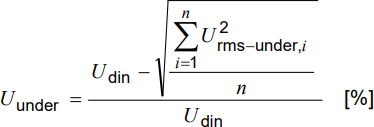
Over deviation and Under deviation |
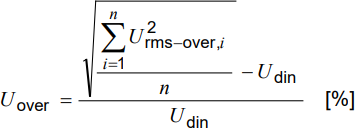
The over deviation (Uover) and (Uunder) are parameters specified for monitoring the deviation of voltage from the configured nominal voltage over a specified period of time (Aggregation Interval) unlike the dip and swell events which are used to monitor any change that happen to the voltage signal at any time. However, there is two parameters that is used to show the over deviation and under deviation instantaneously which are Urms_under and Urms_over which are then used to get the Uunder and Uover across the specified aggregation Interval. They are derived from the Urms 10/12 cycle and are updated each 10/12 cycle according to the IEC- 61000-4-30 standard as follows
where n = the number of 10/12-cycle r.m.s. values for under- or overdeviation during the aggregation interval and Urms−under,i is the ith 10/12-cycle r.m.s. value
where n = the number of 10/12-cycle r.m.s. values for under- or overdeviation during the aggregation interval and Urms−over,i is the ith 10/12-cycle r.m.s. value |
0 to 100% |


Created with the Personal Edition of HelpNDoc: Elevate your documentation to new heights with HelpNDoc's built-in SEO