Power Quality Events Page
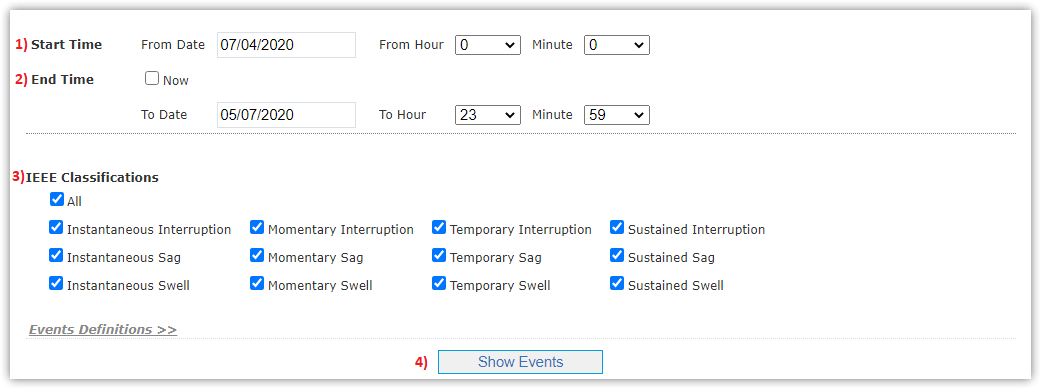
This page displays summary of power quality events in site at specific moments and times according to IEEE classification as following:
- Determine Start Time interval you want to show events from.
- Determine End Time interval you want to show events to and can also select Now to get PQ events till right now.
- Select All parameters of IEEE classification to show events for.
- Events List will appear according to time intervals and parameters determined before, by clicking Show Events button.
|
You can get PQ events only for last 3 months, if you want earlier than this interval just contact Support. |

Events List
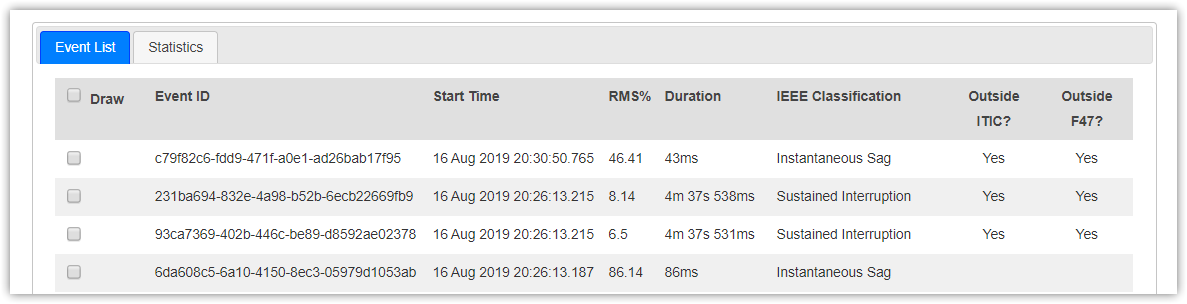
- Beside Events List displayed, Statistics page declares power quality statistics in details with graphs.

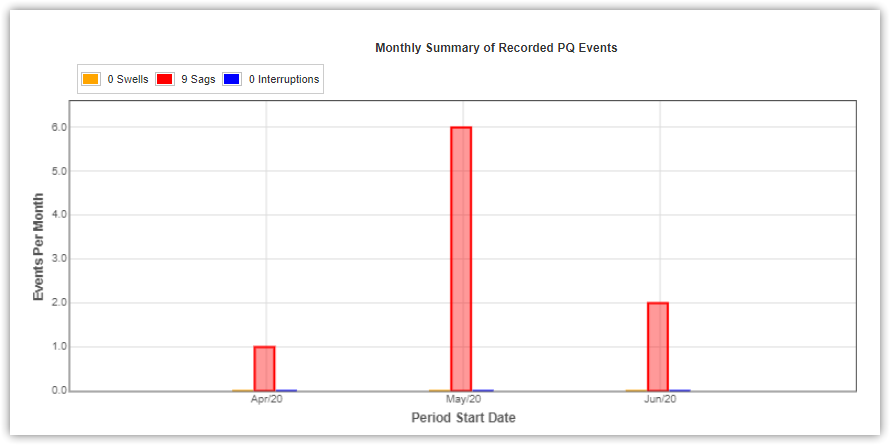
Recorded PQ Events Summary:
- Monthly Summary of Recorded PQ Events
- Weekly Summary Recorded PQ Events
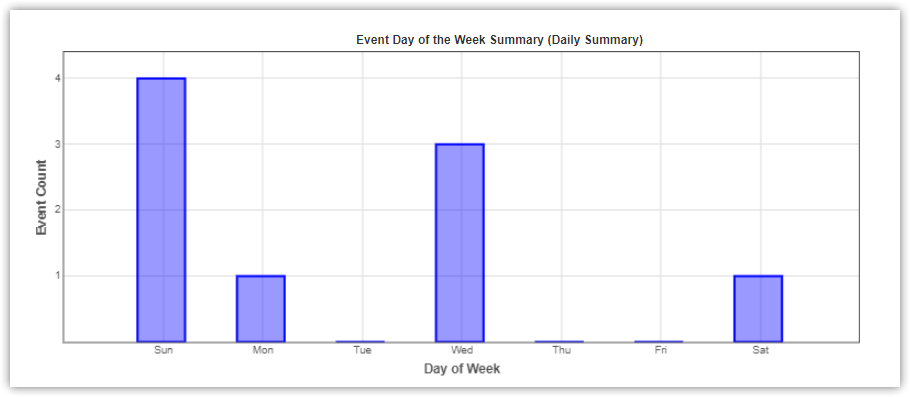
- Event Month of the Year Summary (Monthly Summary)
- Event Day of the Week Summary (Daily Summary)
- Event Hour of the Day Summary (Hourly Summary)
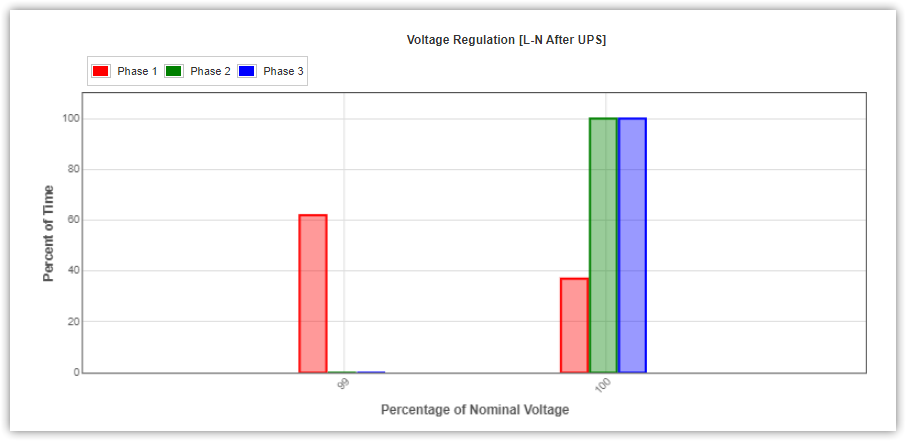
Voltage Regulation
Graphs of voltage regulation are represented according to;
- Phase connections (3 phase / Single phase)
- Line-to-Line / Line-to-Neutral
- UPS connection (after UPS & before UPS)
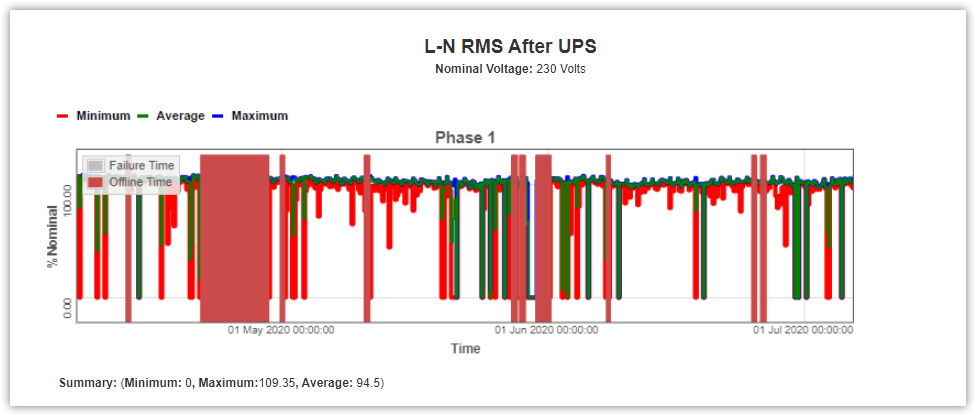
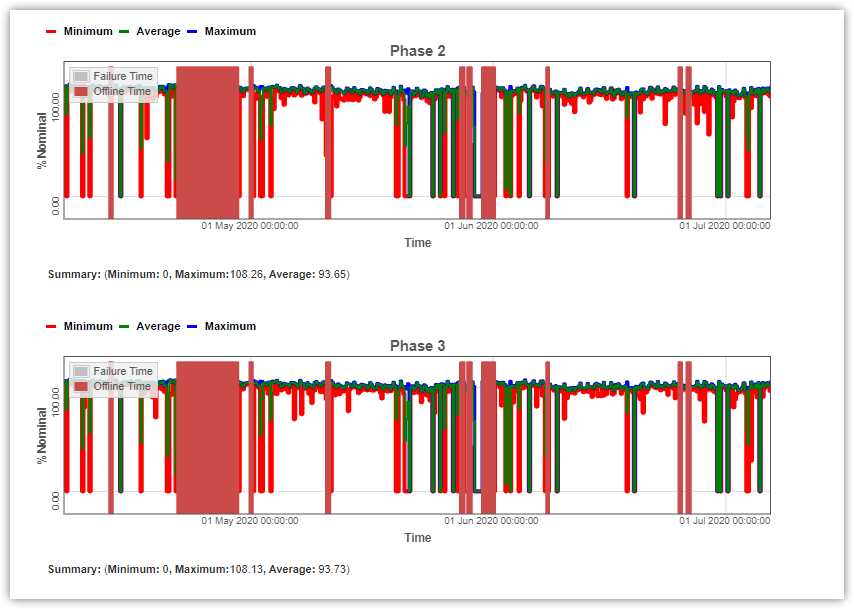
Trend Graphs
Trend graphs are represented according to site's connections (Phase, Lines and UPS).
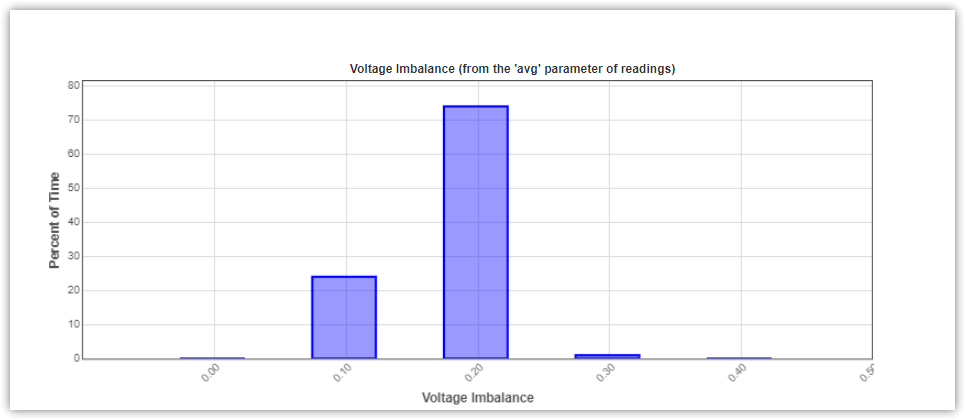
Voltage Imbalance
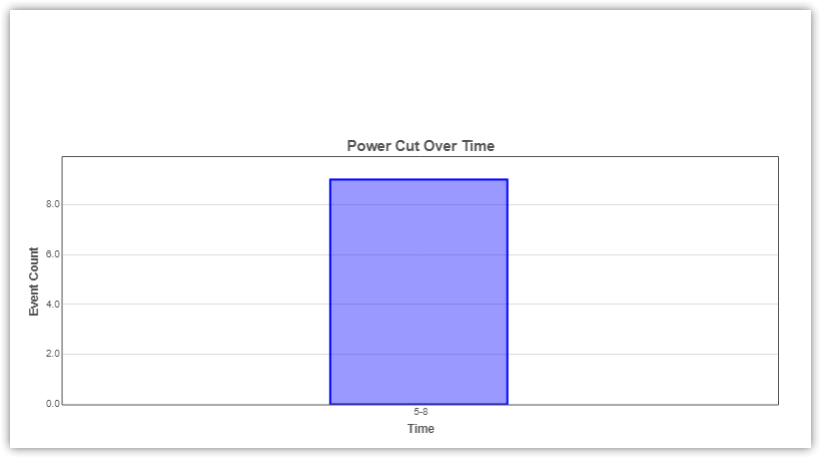
Power Cut
You can generate PDF file with these graphs by clicking Technical Report button.
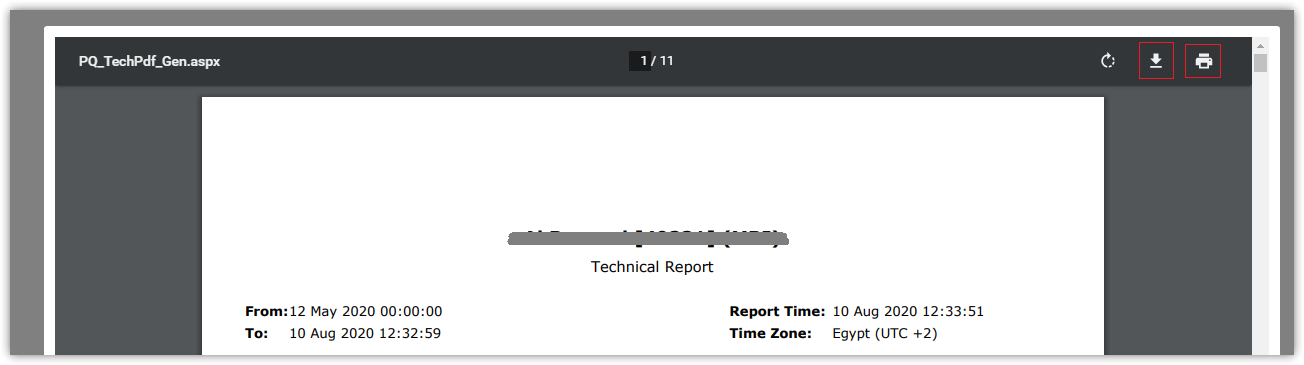
- You can download PDF from download icon
- In case of failure to download file using download icon, click print icon and save as PDF
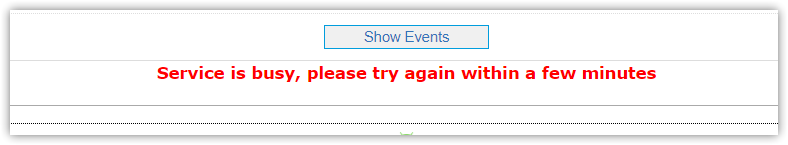
In case of failure to get power quality events, so it's service issue and you've to try again after a few minutes.