PQ Analysis
Power quality analysis can be performed in accordance with the EN50160 standard.
Ride-Through analysis can also be generated based on selected standard curve profiles.
- Events can be viewed within a defined time interval by selecting the start and end date and time.
- The maximum number of retrievable events within a single time interval is limited to 150 events, provided that the selected time span does not exceed 10 days.If either the time interval exceeds 10 days or the number of events exceeds 150, a prompt is displayed requesting that the selected time interval be reduced before retrying.
- Flagged data, including events and trend readings, can optionally be included in or excluded from the analysis.
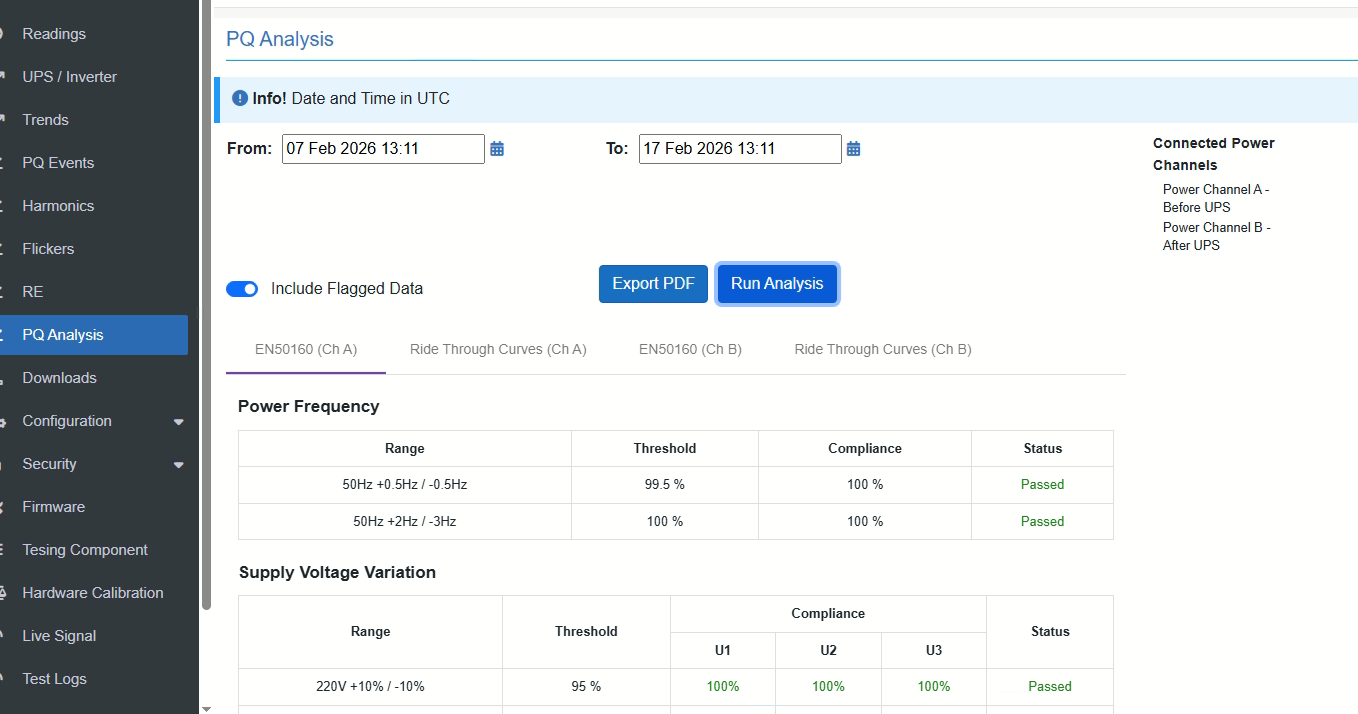
EN50160 Analysis:
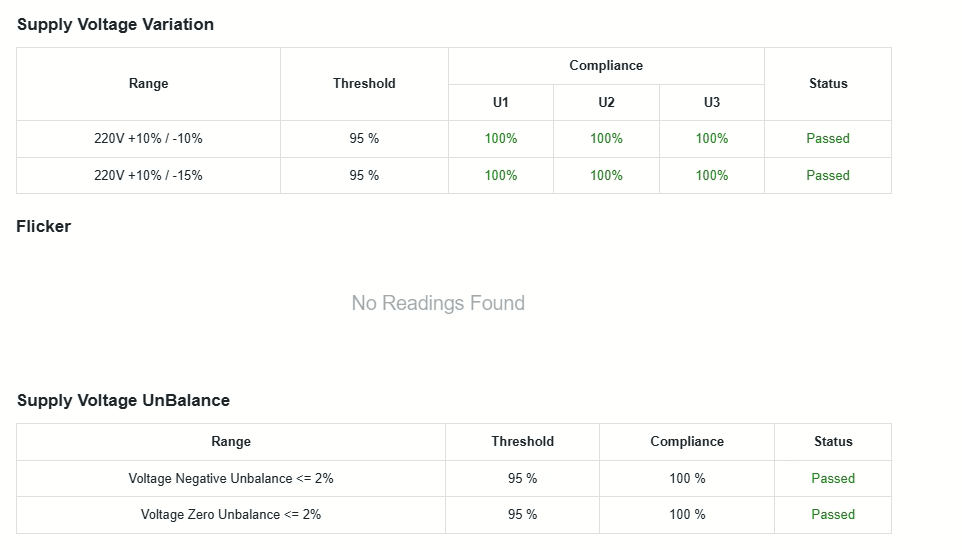
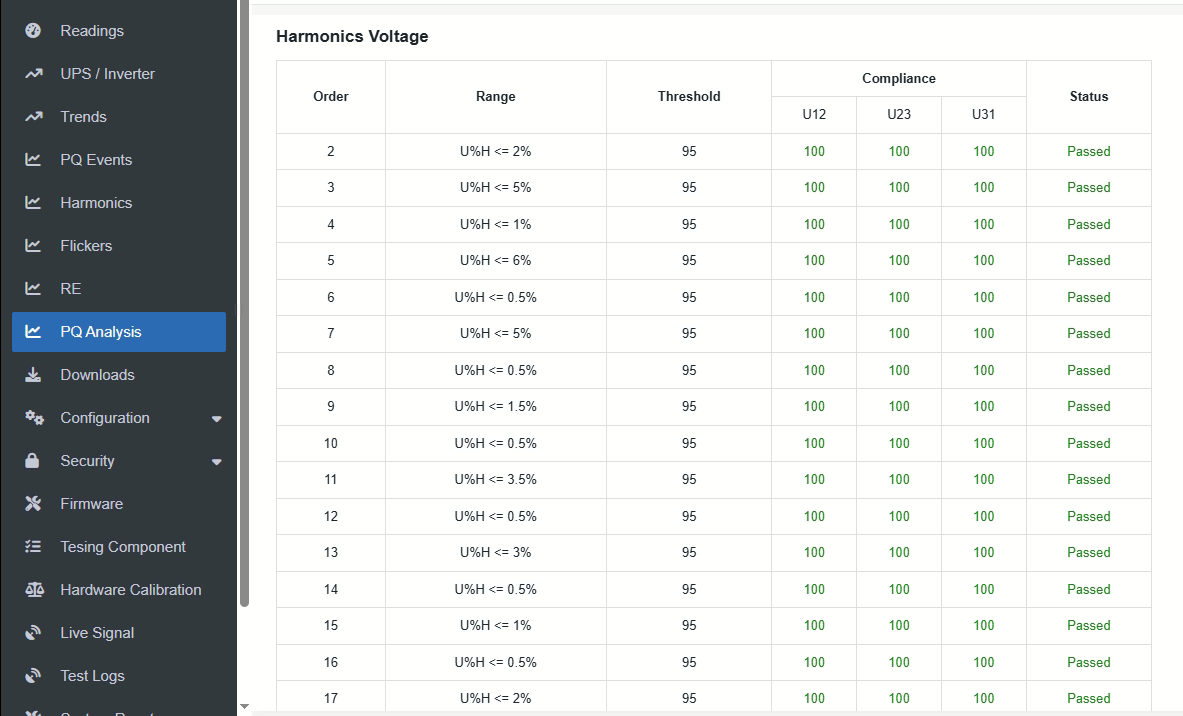
- For each parameter, one or more ranges are defined for comparison.
- The "Compliance" column represents the percentage of measurements within the defined range.
- For example, if the analysis runs on 1000 measurement, and 700 of them are in range, and 300 are out of range, then compliance is 70%.
- The status is determined by comparing the compliance percentage to the "Threshold", so for 95% threshold, the 70% compliance results to "Failed" status.
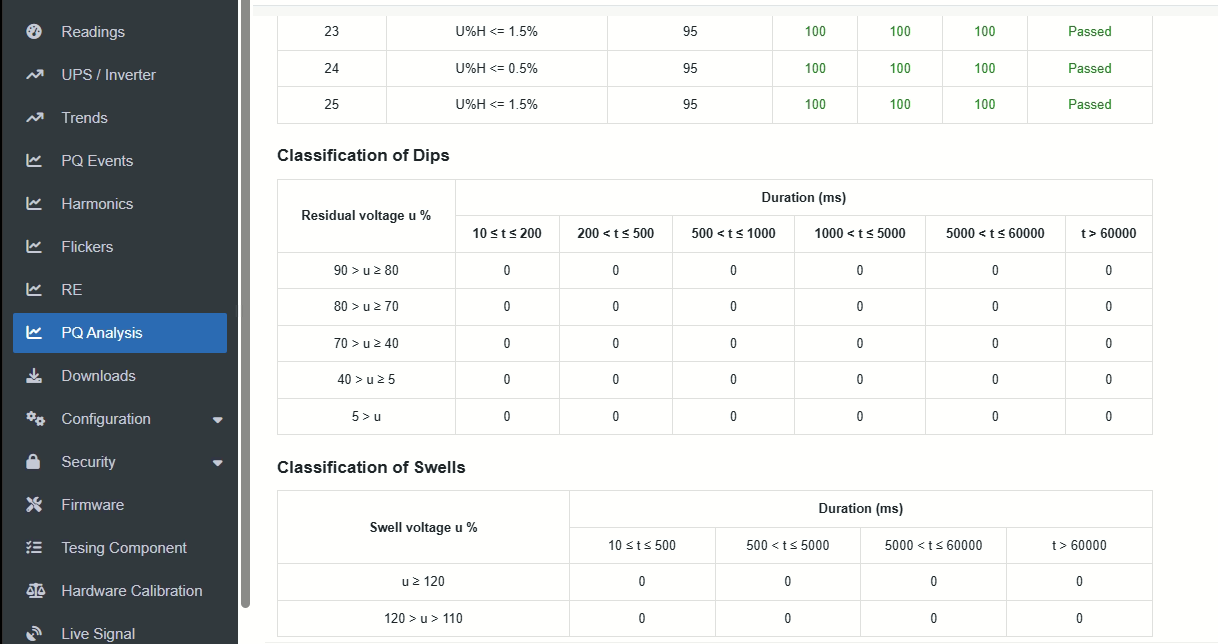
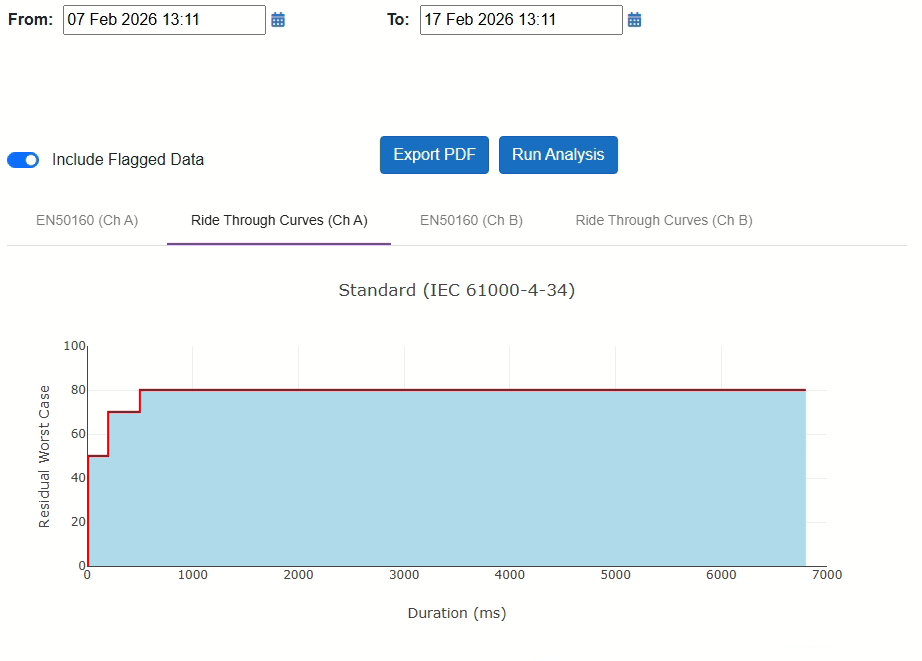
Ride Through Curves:
Dip events are analyzed in terms of duration and worst case value.
All events under the curve are considered major events.
Supported curves:
- Standard (IEC 61000-4-34)
- SEMI F47
- Samsung Power Vaccine
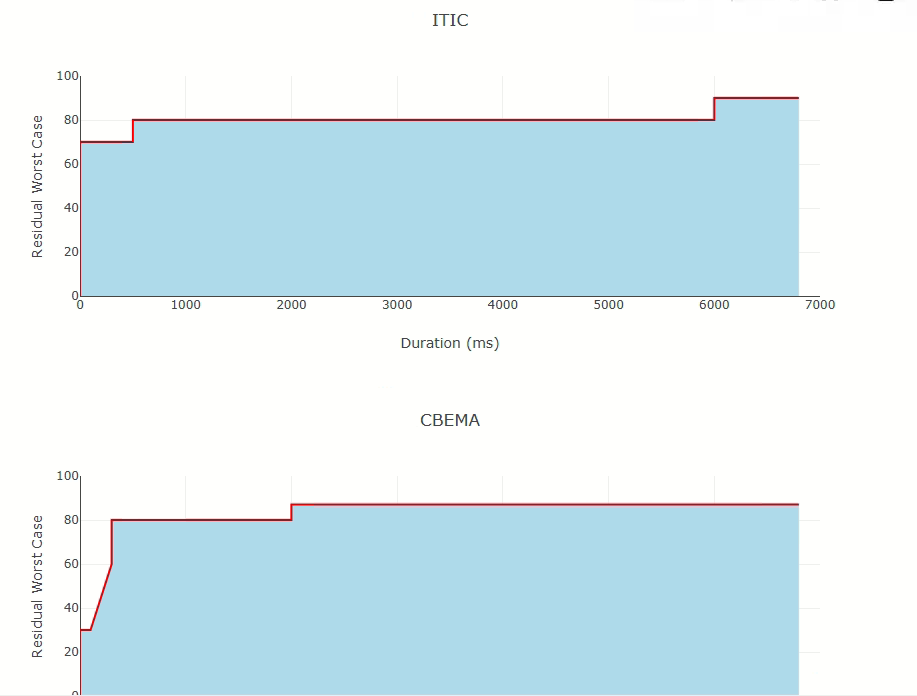
- ITIC
- ITIC High
- CBEMA
- CBEMA High
- MIL-STD 704E
- MIL-STD 1399
Created with the Personal Edition of HelpNDoc: Create cross-platform Qt Help files