Trends
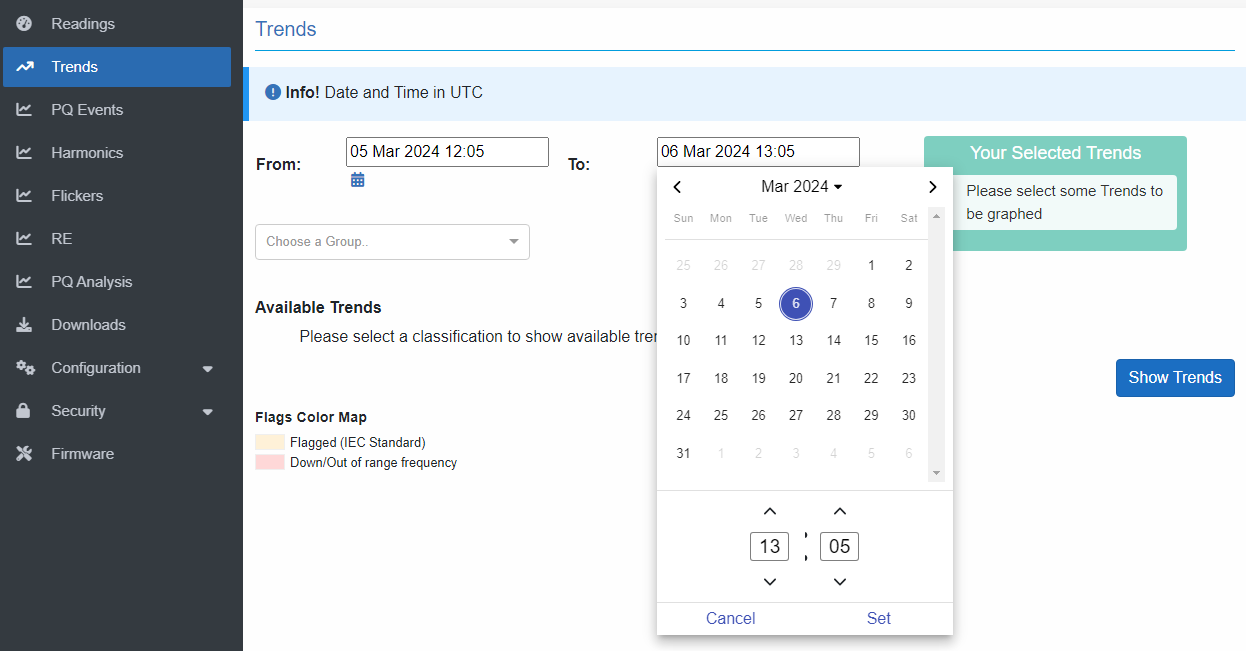
The system provides functionality to generate trend analysis of recorded measurements over a defined time interval based on selected start and end dates.
Note: Maximum total time interval is limited to 30 days.
The groups’ drop-down list is organized as groups of parameters, with one or more groups under a specific classification.
Classifications:
- Electrical
- Environmental
- Analog
- Device Health
- Motors
- RE Measurements
You can scroll and jump to a group, or search in the drop-down list by typing the first letters of the group to auto-filter the list.
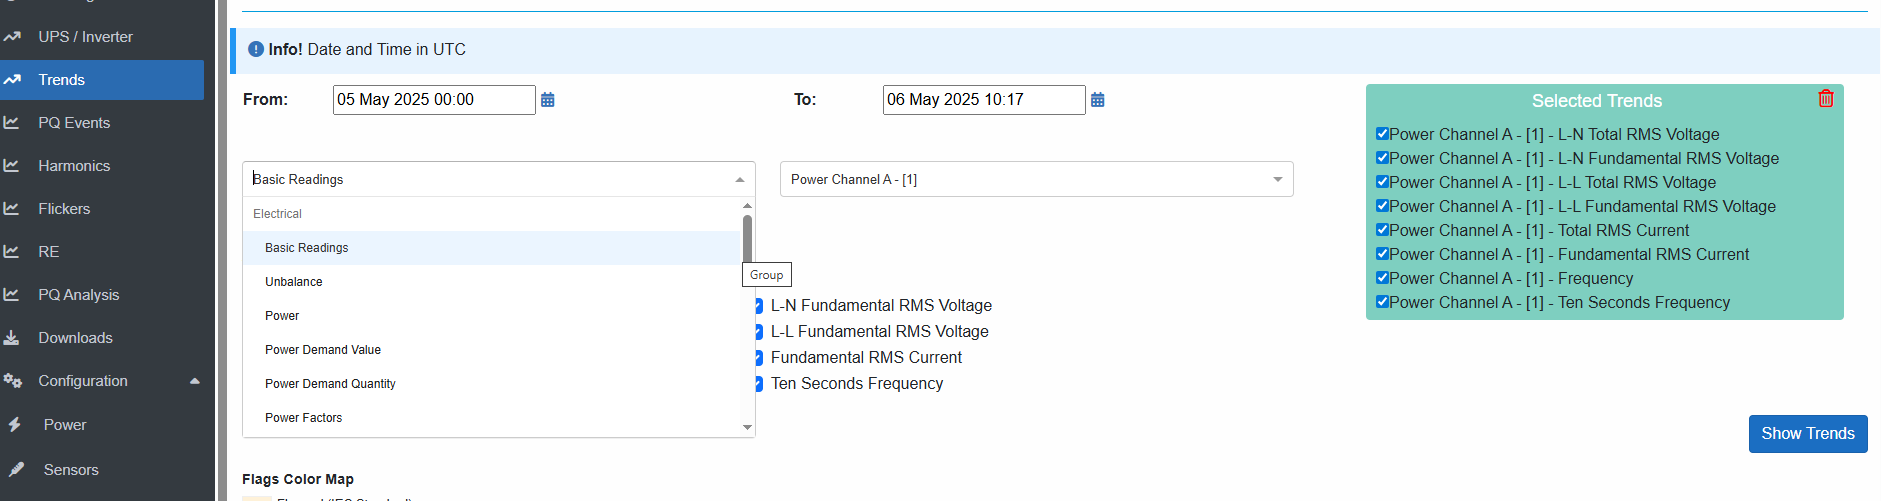
After selecting group, select which channel / unit and mark check-boxes for desired readings.
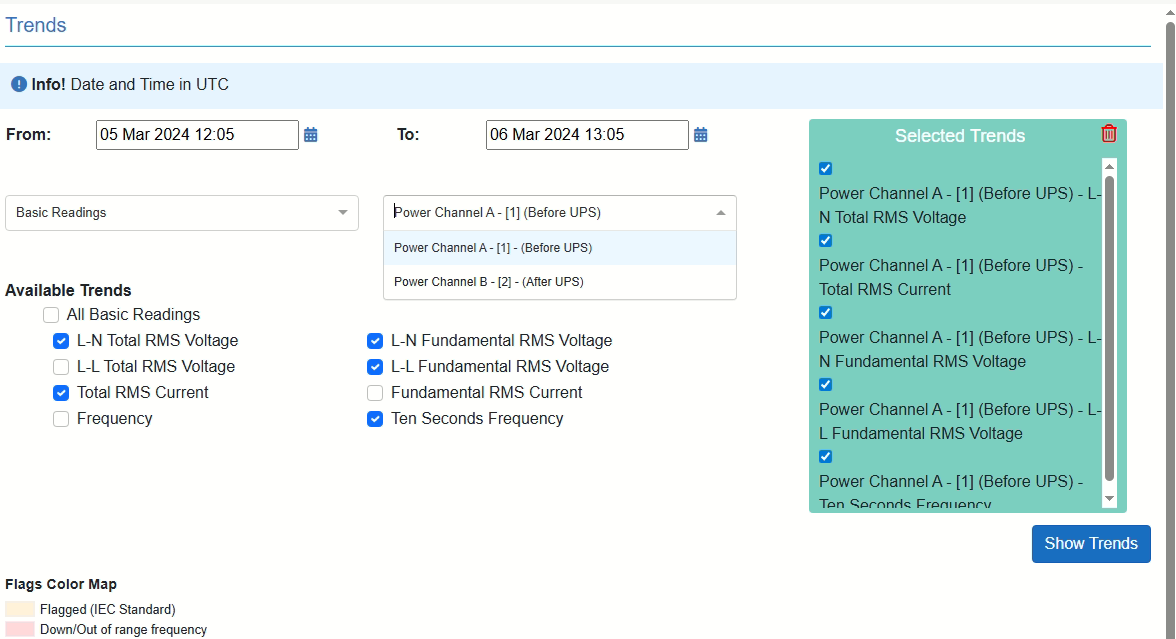
To discard a reading can be either by unchecked the checkbox or by hovering the "Your Selected Trends" list, and remove a parameter by clicking the red remove icon.
Multiple trends from different units can be selected together up to maximum 15 parameters at the same time.
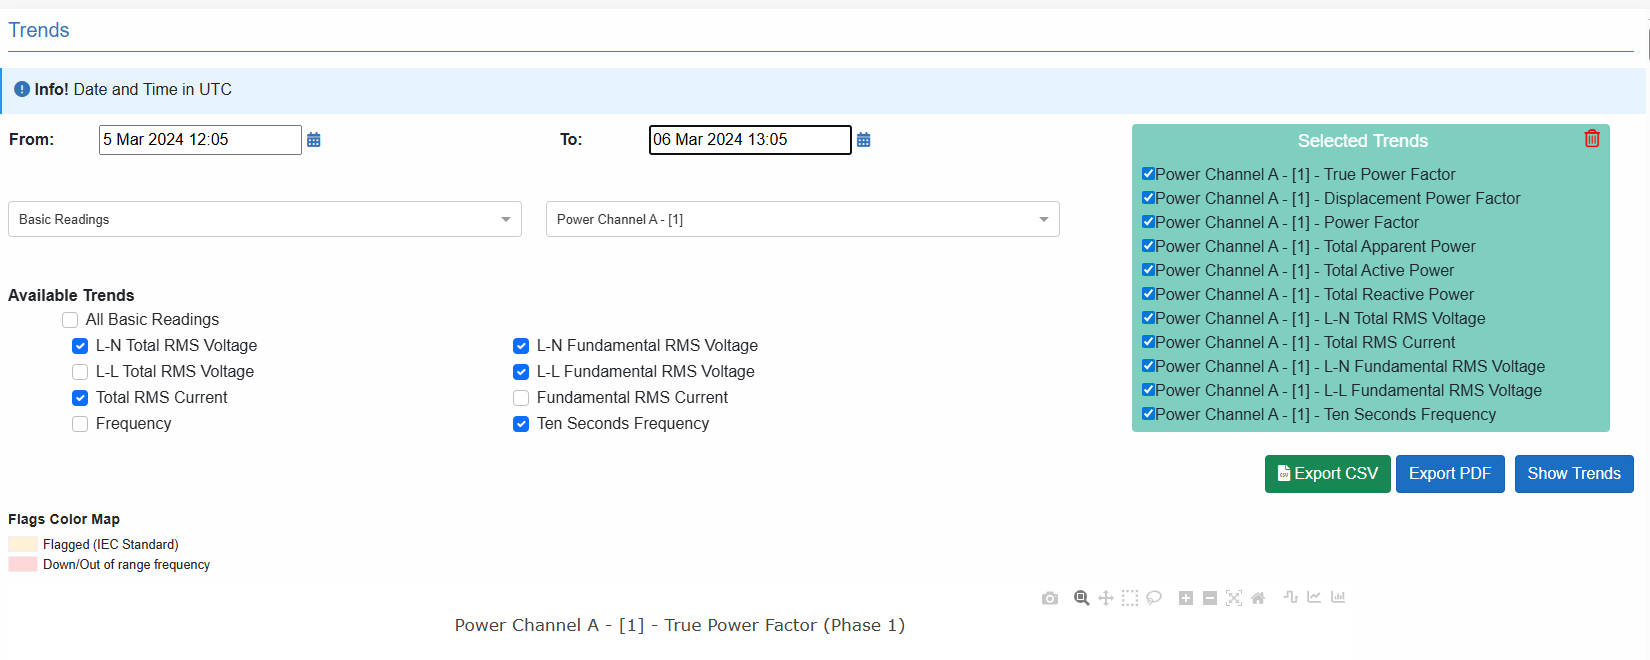
Then click “Show Trends” button to generate trends.
The data can be exported as a PDF report or as a CSV file for further analysis.
Additional Information:
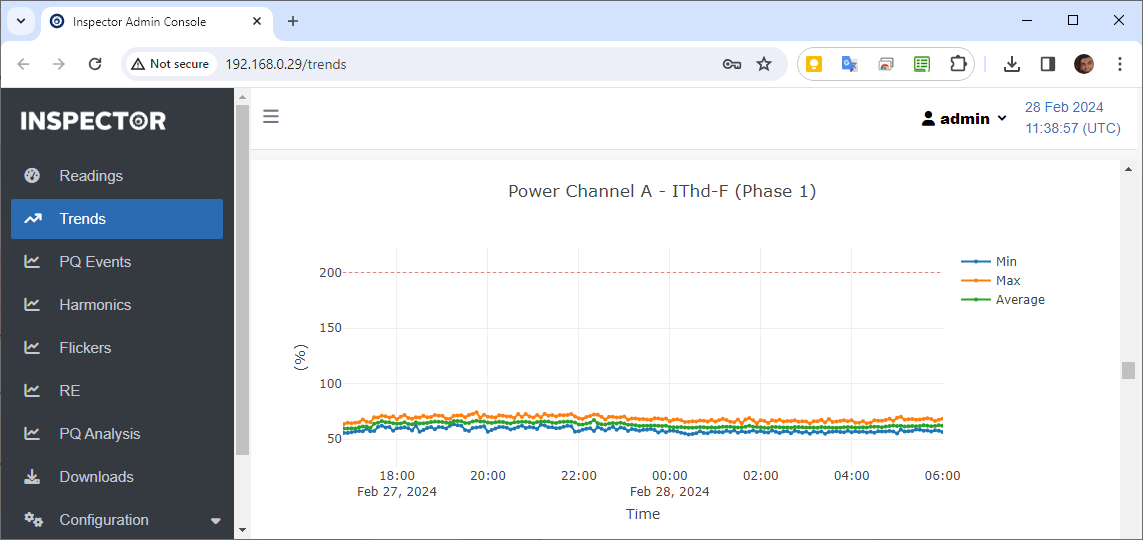
- Parameter Limits:
- For each parameter, there are pre-defined range, and when a measured value goes out of this range, it is being overridden by the range border value that measured value crossed.
- A range limit is represented on the graph by a horizontal dashed line.
- Aggregation:
- Calculated over the last 10 minutes, according to 10-minutes tick concept, which is always a multiple of tens.
For example:
If Inspector is switched ON, and firmware started to measure at 12:03, the interval will start at 12:10, and the first 10-minute tick will be at 12:20.
- In details explanation can be found in Appendix III – Aggregation chapter
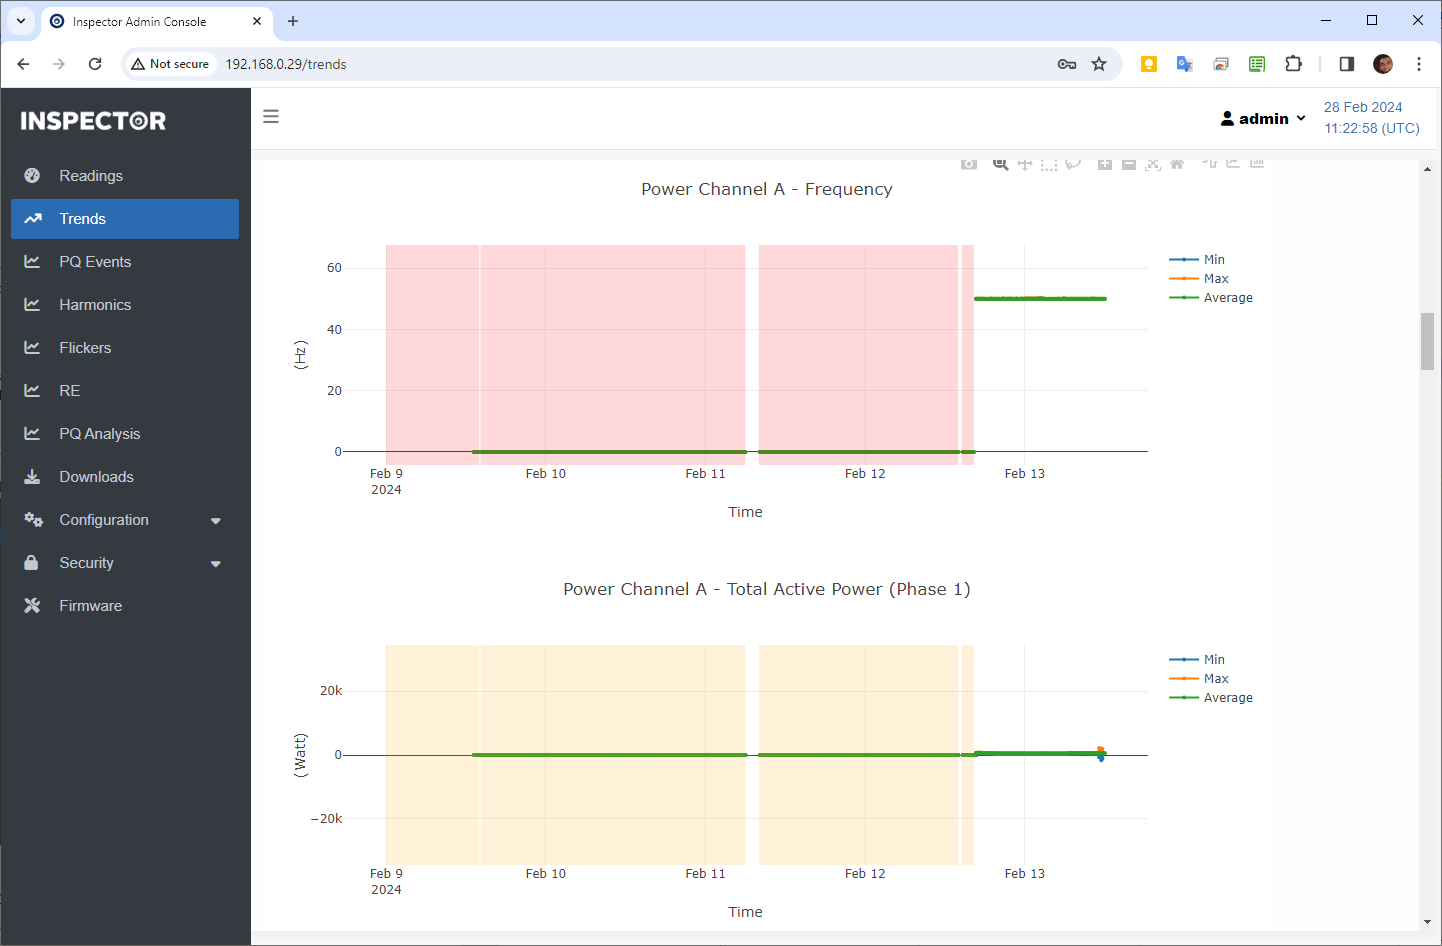
- Flagging:
- When a reading is flagged, the background of the graph takes the corresponding flag color, which covers the preceding area.
- Additional information can be found in Appendix IV – Flagging section below.
- Phase-oriented parameters:
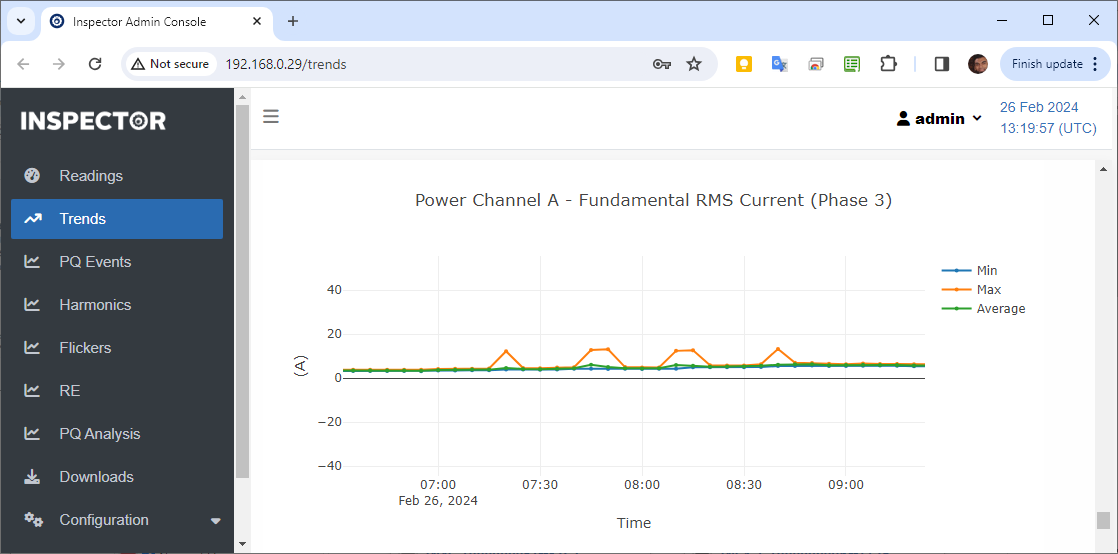
- Only one phase in drawn in each graph.
- Each graph has three curves (min, max, and average) for measured parameter that allow aggregation.
- Missing frames:
- If Inspector is switched OFF or rebooted, or a firmware update is established, then one or more data frame will not be created until Inspector is back to measuring, and an appropriate 10-minutes interval is monitored.
- Represented on Trends graph as a cut.
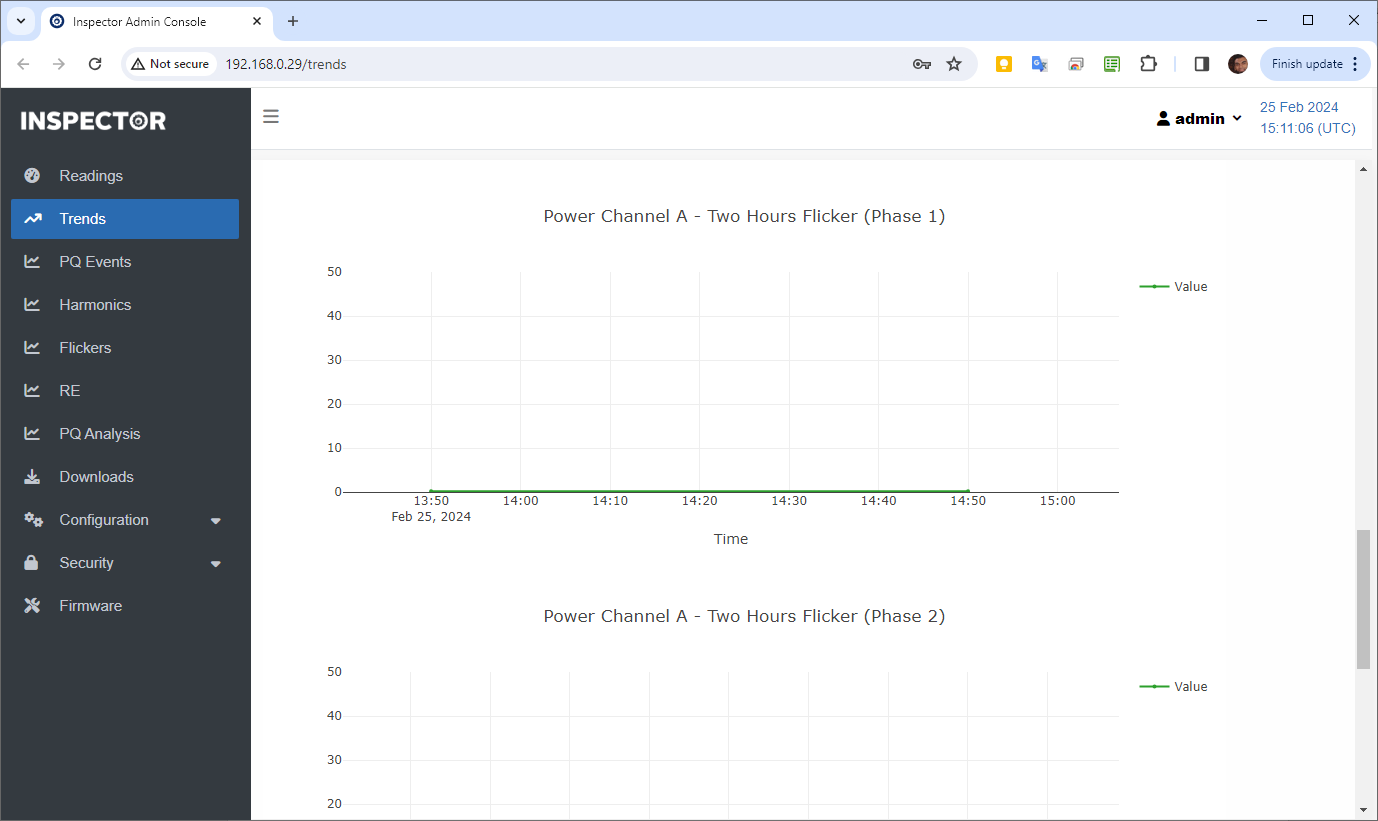
- Long term (two hours) flicker:
- Aggregation over two hours, is calculated using 12 successive short term flicker values, if one or more data frames is missing, Inspector will wait for 12 successive data frames to collect 12 successive short term flicker values to calculate long term flicker on.
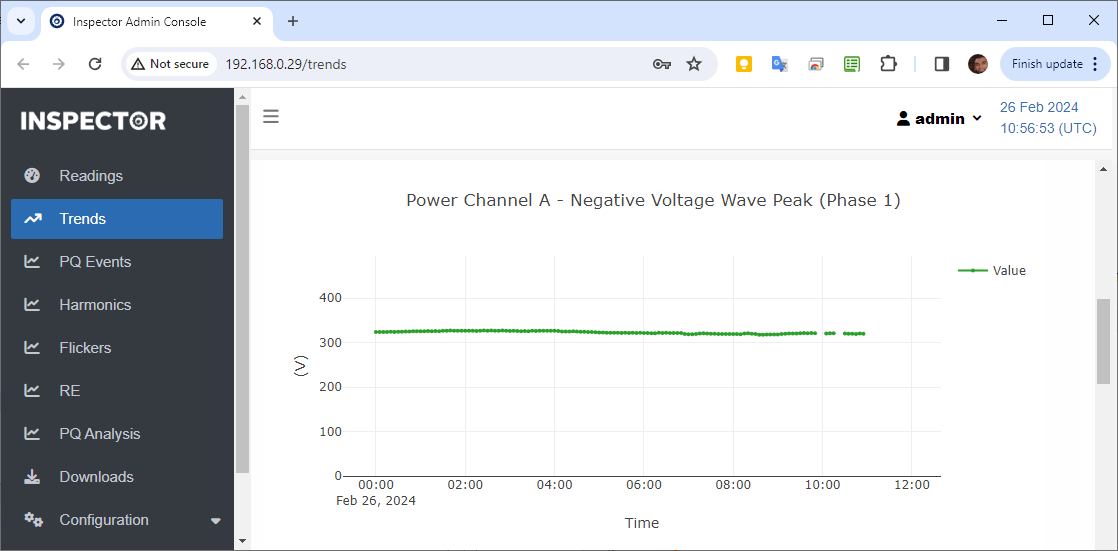
- Earth resistance, line and loop impedance:
- Measured once every 24 hours.
- They are not aggregated and are drawn on graph as circle plots with no connected curves in between.
Created with the Personal Edition of HelpNDoc: Bring your WinHelp HLP help files into the present with HelpNDoc's easy CHM conversion