Most facilities that buy a power quality analyzer already have a meter on the incomer. The meter tells them how much energy they used. It does not tell them why a production line stopped at 02:14 on a Tuesday, why a transformer runs hot, or whether the UPS protected the load during last week’s dip. A power quality analyzer exists to answer that second kind of question — and the best way to choose one is to start from the question, not from the parameter list.
This guide explains what an analyzer actually records, how to read that evidence without over-reading it, and how to match the deployment — fixed, portable or panel-mounted — to the job.
Start with the decision, not the sensor
A useful monitoring system helps a team decide where to investigate, which intervention is justified, and whether that intervention worked. Every investigation in our application guides follows the same four questions:
| Engineering question | What a useful answer contains |
|---|---|
| What changed? | A timestamped event or a repeatable trend, with the operating state and the data quality alongside it. |
| Where should we investigate? | A comparison across locations or measurement domains, with the alternative explanations listed. |
| What should we do? | A targeted inspection or an approved corrective action, owned by the right team. |
| Did the action work? | A repeat measurement under comparable conditions, plus a record of the physical result. |
If an instrument cannot contribute to at least one of those answers for the problem you have, it is the wrong instrument — however long its specification sheet is.
What a power quality analyzer records
A modern analyzer samples voltage and current fast enough to see the waveform, not just its RMS average. From that it derives two kinds of information:
- Continuous characteristics — voltage and current RMS, frequency, unbalance, harmonics and interharmonics, total harmonic distortion (THD), flicker, active, reactive and apparent power, true and displacement power factor.
- Discrete events — voltage dips (sags), swells, interruptions, transients, rapid voltage changes and inrush, each with a timestamp, a duration and a depth.
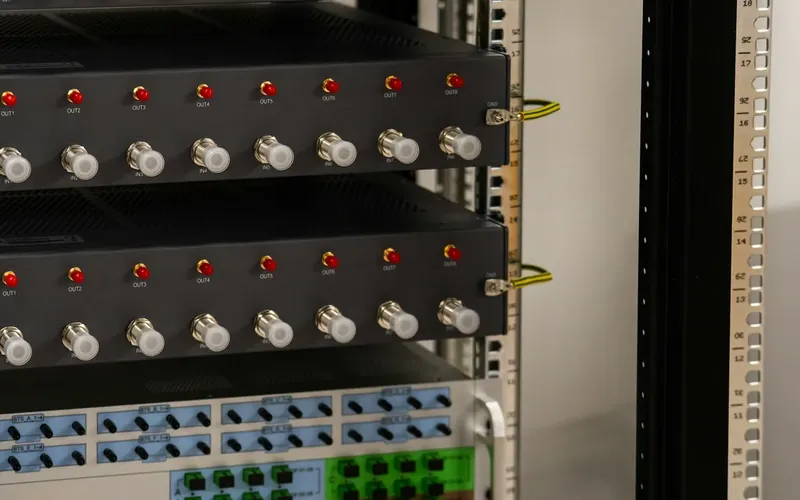
The event record is where most of the diagnostic value sits. A trend that averages over ten minutes will hide a 120-millisecond dip completely; the event record will show it, and — if the instrument stores the waveform — show its shape. Inspector V4, for example, classifies events using the methods of IEC 61000-4-30 and keeps five cycles of waveform before and after every event, so the engineer can see what the supply looked like as the disturbance arrived, not just that it happened.
Two channels change the question you can answer
A single measurement point tells you that a disturbance occurred. Two time-aligned points — the incoming supply and the affected feeder, or the UPS input and output — tell you where it came from and whether it reached the load. Inspector V4 and the Portable V4 have two isolated power quality channels for exactly this reason. Several of our guides, including tracing production stops and verifying a UPS, depend on that pairing.
Context turns a reading into evidence
An electrical event rarely explains itself. A cooling failure, a door left open, a vibration change or a drive fault can each produce the same complaint. Recording temperature, humidity, air quality, vibration, motor current or 4–20 mA process signals on the same timeline as the electrical data lets an engineer rule explanations in or out instead of guessing.
Where the evidence stops
The most expensive interpretation error is using a valid number to answer the wrong question. A few boundaries are worth stating plainly:
| Data type | Good use | Do not assume |
|---|---|---|
| Electrical waveforms and events | Investigate voltage and current behaviour at a defined location and time. | That an event timestamp alone proves fault direction or responsibility. |
| UPS telemetry | Add mode, battery and alarm context from that specific UPS. | That similar input and output voltages prove bypass or online operation. |
| Overall vibration (4–20 mA) | Trend a processed engineering quantity and escalate changes. | That a processed scalar is a raw waveform suitable for FFT analysis. |
| PV AC/DC plus environment | Assess a defined power balance under comparable conditions. | That a DC operating point is an I-V curve. |
| Cloud trends and indicators | Compare history, assign a review, document closure. | That a score or a cloud connection establishes remaining useful life. |
A small quality gate prevents a large false conclusion. Before interpreting any incident, check channel labels, units, wiring and polarity, sensor ranges, timestamps, averaging windows, operating state and missing-data flags. Most “impossible” readings turn out to be a swapped clamp or a misaligned clock.
Choosing the deployment
The Inspector range separates fixed, portable and panel-mounted instruments. The right choice depends on whether you are answering one question once, or watching a critical asset continuously.
| Deployment | Best fit | Confirm before specifying |
|---|---|---|
| Inspector V4 (fixed) | Permanent monitoring of critical assets, paired UPS monitoring, long-term baselines. 0–1000 V RMS, CAT III 1000 V, built-in earth resistance and earth current, 6-hour battery. | Probes, recording settings and time synchronisation for the site. |
| Portable V4 | Site surveys, troubleshooting and audits. The same measurement engine with a 7″ touchscreen. | A safe connection plan and a repeatable survey method. |
| Panel Mount Standard / Compact | Embedded AC monitoring plus a DC channel (0–630 V DC) for solar, storage, EV charging and DC distribution. | Voltage range, DC arrangement and sensor count. |
| Panel Mount Lite | Environmental monitoring only — temperature, humidity, air quality, vibration — for server rooms, stores and warehouses. | It has no AC/DC power quality channel. |
| Inspector Cloud | Multi-site trends, event review, alerts and maintenance coordination. | Enabled features, data retention and access control. |
Configuration matters. Motor electrical analysis, current signature analysis, VFD analysis, advanced vibration and PV analytics each depend on a specific combination of hardware, sensors and software release. Ask us which functions are released for your configuration before you specify them — a feature listed in a roadmap is not the same as a feature on a delivered system.
A checklist for comparing analyzers
When you compare instruments — ours or anyone else’s — ask for these in writing:
- The measurement method and its scope. Which standard does the instrument follow for each quantity, which edition, and what does any certificate actually cover?
- Event capture. What is recorded per event: a timestamp, an RMS profile, or the waveform itself — and for how many cycles either side?
- Number of synchronised channels. Can it compare two points on the same timeline?
- Voltage and current ranges, accuracy and measurement category for the points you intend to connect.
- Context inputs. Can temperature, vibration, motor current or process signals share the timeline?
- Data path. Local storage, protocols (Modbus, BACnet, DNP3, IEC 61850, MQTT, SNMP), cloud access and export formats.
- What happens when communications fail — does the instrument keep recording, and does the dashboard show that the data is stale?
Measure value without inventing savings
A credible result reads like this: “The investigation identified a repeatable condition; maintenance addressed it; the condition did not recur during the stated follow-up period.” Add savings only when the assumptions and the outcome evidence support them. Track a small set of measures that connect to the original problem — unexplained stops, disturbed loads, recovery time, confirmed findings — over comparable before and after periods.
Where to go next
Pick the guide that matches the symptom on your site:
- Lines stopping without a visible cause → Why production lines stop “for no reason”
- Hot transformers, neutral current, poor power factor → Harmonics and poor power factor
- A dispute with the supplier, or a new process to commission → Building a defensible power quality baseline
- Imaging or lab equipment aborting cycles → Equipment fault or site power?
- Motors, pumps and fans → Predictive maintenance without the hype
Not sure which instrument fits?
Describe the failure in a 20-minute call and an engineer will tell you what we would measure, where, and with which model. Book a meeting